19 Logistic regression
[Chapter currently under construction]
In this chapter we'll look at our final regression technique, logistic regression. Unlike linear regression, which predicts a continuous outcome variable based on one or more predictor variables, logistic regression is used when the outcome variable is categorical. The most common form of logistic regression is binary logistic regression, where the outcome is limited to two categories such as Yes or No, Diagnosis or No Diagnosis, or 1 or 0.
For instance, imagine you're interested in exploring factors that predict whether individuals are likely to have high blood pressure. While linear regression could help you predict something continuous like systolic blood pressure measurements, logistic regression would help you predict whether someone is likely to have a diagnosis of hypertension (high blood pressure) or not.
Logistic regression uses a mathematical function that transforms linear input into a probability between 0 and 1. The logistic function has an "S" shape, allowing it to smoothly transition between the two extremes.
19.1 Modelling a logistic function
The S-curve in logistic regression is essentially plotting the probability of an event occurring across the range of a predictor variable. In the example below I have plotted stress level (on a scale between 0 and 50) against the probability of an individual relapsing for a particular damaging behaviour (i.e, drug taking, smoking etc).
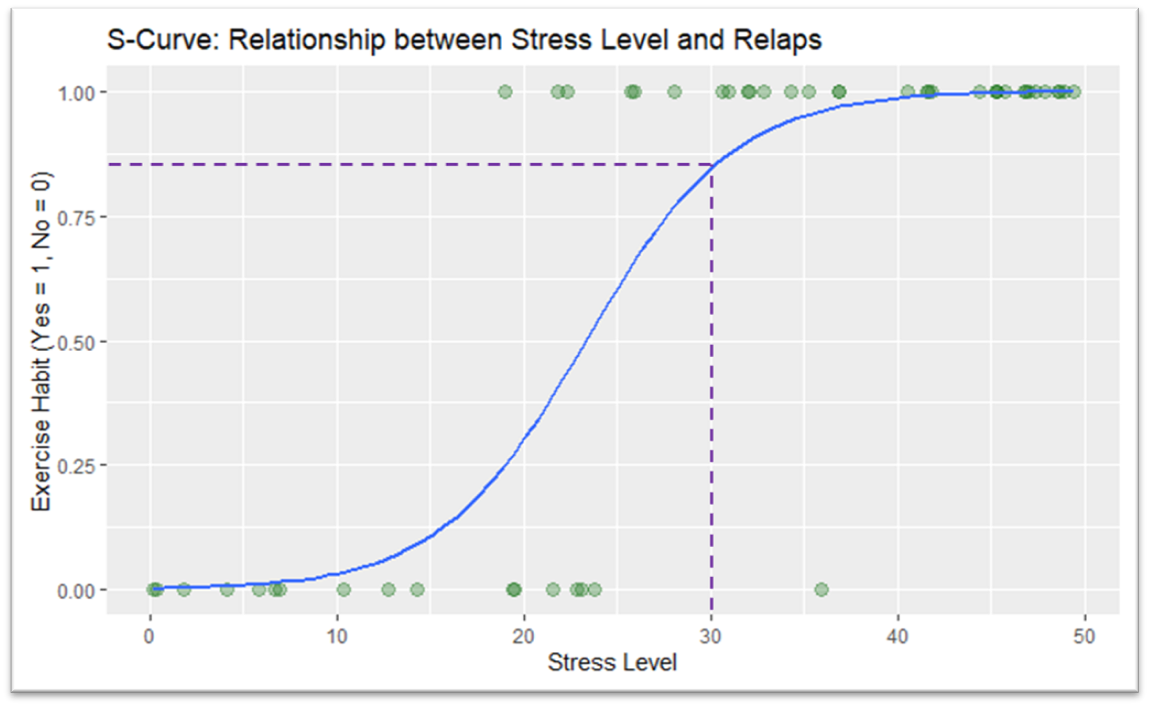
The curve that we add to such a relationship works similarly to the line of best fit between the datapoints that we first used in the simple regression chapters. If we want to work out the chance of relapse for an individual that scores a 30 on the stress variable all we need to do is trace the point from 30 to the line and then read off the corresponding y-axis point. In this case the value is around 0.6 indicating that, according to out model, a scores of 30 on the scale indicates that an individual has a 85% estimated probability of experiencing a relapse.
19.2 Understanding odds ratios in the context of logistic regression
In the previous section we talked about the probability of an event (probabilities being between 0 and 1) however we can also talk about the same data in terms of odds, particularly how the odds of an relapse event increase as a function of an increase in the stress variable.
Odds ratios are calculated from the coefficients (\(\beta\)) in the logistic regression model (JASP calculates them automatically if you tick the odds ratio button so I won't go into the maths here). An odds ratio greater than 1 indicates that as the predictor variable increases, the odds of the outcome occurring also increase. Conversely, an odds ratio less than 1 indicates that as the predictor increases, the odds of the outcome occurring decrease.
In the case of our current model our odds ratio is 1.29 indicating that for every unit increase in stress the chance of relapse increases by 29%.
Possible data set: https://journals.plos.org/plosone/article?id=10.1371/journal.pone.0255683#sec019
[Chapter currently under construction]