7 How to Conduct a Power Analysis
To conduct an a-priori power analysis (working out the statistical power of a study before conducting the study), for a difference test, we need a number of pieces of information: 1. The design of the study, how many IVs, and how many levels to those IVs 2. A likely effect size that we would expect in our designed study 3. Our chosen values for alpha and power (1-beta)
There is a mathematical way in which you can calculate the sample size needed in such a study but for the purposes of your undergraduate studies there are two simpler ways in which you can calculate sample size for your own studies. Firstly, there is Cohen’s power primer, a simple but limited way, and secondly is with G*Power an application that allows for more customisable power calculations.
7.1 Cohen’s Power Primer
Imagine you are conducting a study to examine the effect of a new relaxation technique on reducing stress levels. You plan to compare stress scores between two groups: one group practicing the relaxation technique and a control group not practicing it. Your goal is to determine the required sample size to detect a significant difference in stress scores between the groups.
To conduct an a-priori power calculation using Cohen’s Power Primer, we would start by deciding on the expected effect size, often to do this we would have read the literature and hopefully found previous research, studying a similar topic, which we could base our calculation on. If not we often assumed to be medium a medium effect size (Cohen’s d = 0.5).
Next, we’d choose our alpha level (α), the significance threshold, commonly set at .05 (5%), .01 (1%), or .10 (10%); for this example, we will use α = .05.
Then, we’d determine our desired power (1 - β), which is the probability of correctly rejecting the null hypothesis when an effect exists; a typical target is .80 (80%).
After defining these parameters, locate the appropriate section in Cohen’s Power Primer table (see below), specifically the section titled "1. Mean dif" (which stands for the difference between means, i.e. a t-test). Find the column corresponding to your chosen alpha level (.05) and locate the row for a medium effect size (Med). From the table, read the sample size required for adequate power; for a medium effect size at α = .05, the table indicates 64 participants per group. To determine the total sample size for your study, multiply the number of participants per group by 2, as this is an independent samples t-test comparing two groups: 64 participants in Group 1 plus 64 participants in Group 2 equals a total of 128 participants. This calculation would therefore means that to detect a medium effect size with 80% power at an alpha level of .05, we would need a total of 128 participants (64 per group).

The different rows on grid can be used for different statistical tests with different number of conditions or different number of variables.
However, this is not comprehensive (for instance the table cannot be used for factorial ANOVA). For more complex power calculations it is best to use the program G*Power
7.2 G*power
7.2.1 Installation and opening the application
First step is for you to download the application, if you are on a university computer it should already be installed and you should be able to access it through the desktop search bar.
If you are on your own computer you’ll need to download it from the following webpage: https://www.psychologie.hhu.de/arbeitsgruppen/allgemeine-psychologie-und-arbeitspsychologie/gpower
Yes, this is the right place, its hosted on the university of University Düsseldorf which is why some of the web page is in German. The instructions to download and the app itself is in English, so this won’t be an issue for you.
7.2.2 Conducting an a-priori power calculation for a t-test
- Select the t-test from the test family drop down menu.
- Then select that in this case we would like a power analysis for a independent samples difference between two means.
- Then input our expected effect size, alpha level, and power
- The allocation ratio is just for if we wanted unequal groups for some reason (i.e. the intervention is more expensive than the control), we can just leave this as one.
- Then click calculate
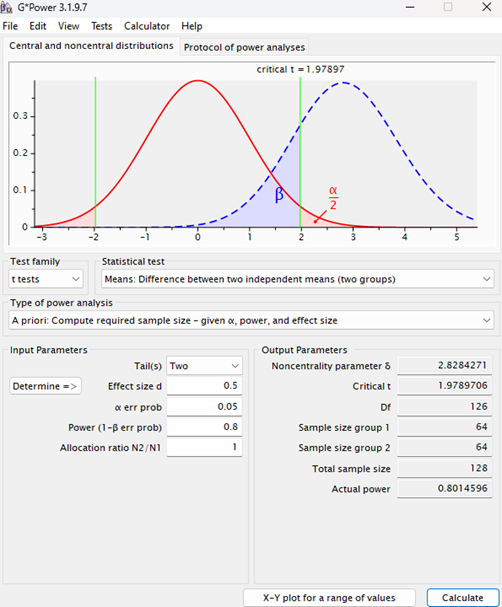
The graph at the top shows two curves: the red curve represents the null hypothesis distribution, and the blue dashed curve represents the alternative hypothesis distribution, with shaded areas highlighting the probabilities of Type I error (α) and Type II error (β).
And as with the Cohen’s power primer, the results of this analysis indicate that we should recruit 64 participants per group, totaling 128 participants, to achieve the target power. In this case it would give us an actual power of 0.801, assuming that our effect size for our study is a medium effect size (which is often a big assumption).
[check back for video of power analysis demo later in the semester]