5 JASP Workshop - Conducting T-Tests (Independent and Paired)
JASP is a free, open-source statistical software package designed with a user-friendly, point-and-click interface, ideal for research in psychology. It offers a wide range of statistical analyses, including t-tests, ANOVA, regression, and more. This guide will walk you through the steps for conducting independent and paired samples t-tests in JASP, highlighting the critical points to check and report in your analysis.
JASP is available on most university computers, but we recommend installing it on your personal laptop or desktop to continue learning outside class. You can download JASP here: www.jasp-stats.org.
The following video shows you how to install JASP on your own computer, talks you through how to open your data in JASP, and gives you an overview of how to use the program.
5.1 T-Test Video Walkthrough
In the below video, I work through example analyses of both independent and paired samples t-tests. If you want to follow along, please find the corresponding question sheets and datasets available in the NS5108 module on Moodle.
Independent samples t-test in JASP:
Paired samples t-tests in JASP:
5.2 "Where to Click" Guide - Conducting T-Tests in JASP
Sometimes you just want to know where to click to run the test. Below is a step-by-step guide for performing independent and paired samples t-tests in JASP. Refer to the video above for more context regarding these steps.
5.2.1 Conducting an Independent Samples T-Test
- Open JASP and load your data: Click on the File tab at the top left, select Open, and navigate to the folder containing your data file.
- Visualise the Data: Click Descriptives -> Descriptive Statistics and move the variables of interest into the Variables box. To visualise the distribution, use histograms or boxplots to check the spread and identify potential outliers.
- Check Assumptions:
- Normality: Check normality by clicking Plots -> Q-Q plots. Look for data points that should lie approximately along the diagonal line.
- Homogeneity of Variance: Conduct Levene’s test by clicking T-Tests -> Independent Samples T-Test. Move the grouping variable to Grouping Variable and your dependent variable to Dependent Variable. Ensure the option Equality of variances test (Levene’s) is checked.
- Run the T-Test: Under T-Tests -> Independent Samples T-Test, input your dependent and grouping variables (you’ll have already done this if you’ve checked for homogeneity of variance). Extract the t-value, degrees of freedom (df), and p-value from the output.
- Interpret the Results: Determine if there is a statistically significant difference between the groups based on the p-value (p < .05 typically indicates significance).
5.2.2 Conducting a Paired Samples T-Test
- Open JASP and load your data as before.
- Visualise the Data: Identify your paired variables and use histograms or boxplots to visualise their distribution. This helps in assessing normality and checking for potential outliers.
- Check Assumptions:
- Normality: Use the Q-Q plots to visually check if the paired differences are normally distributed.
-
Homogeneity of Variance: For paired samples t-test, homogeneity of variance is assumed. Due to the same participants providing data for each level of the IV.
- Run the Paired Samples T-Test: Click T-Tests -> Paired Samples T-Test. Move the paired variables into the Paired Variables box. Extract the t-value, degrees of freedom, and p-value from the results.
- Interpret the Results: Check the p-value to determine if the difference between the paired groups is statistically significant.
5.3 APA Style Guide for Reporting T-Tests
Here’s how to format your hypotheses and report results from your t-tests in APA style.
Hypothesis for an Independent Samples T-Test (two-tail/non-directional): - Null Hypothesis (H0): There is no significant difference in [the dependent variable] between [the two groups]. - Alternative Hypothesis (H1): There is a significant difference in [the dependent variable] between [the two groups].
Hypothesis for an Independent Samples T-Test (One-Tail/Directional): - Null Hypothesis (H0): There is no significant difference or [Group 1] does not have a higher/lower [dependent variable] than [Group 2]. - Alternative Hypothesis (H1): [Group 1] has a significantly higher/lower [dependent variable] than [Group 2].
Example APA Report for an Independent Samples T-Test: > “An independent samples t-test was conducted to compare reaction times between a [variable name] group and a [variable name] group. Assumption checks confirmed normality and equal variances. The results showed a significant difference between the groups, t(df) = t-statistic, p = p-value, indicating that [dependent variable] [greater/lower] in the [condition 1/2] group compared to the [condition 1/2].”
Hypothesis for a Paired Samples T-Test (Two-Tail/Non-Directional): - Null Hypothesis (H0): There is no significant difference in [the dependent variable] between [Condition 1] and [Condition 2]. - Alternative Hypothesis (H1): There is a significant difference in [the dependent variable] between [Condition 1] and [Condition 2].
Hypothesis for a Paired Samples T-Test (One-Tail/Directional): - Null Hypothesis (H0): There is no significant difference, or [Condition 1] does not result in a higher/lower [dependent variable] than [Condition 2]. - Alternative Hypothesis (H1): [Condition 1] results in a significantly higher/lower [dependent variable] than [Condition 2].
Example APA Report for a Paired Samples T-Test: > “A paired samples t-test was conducted to compare test scores before and after an intervention. Assumption checks confirmed normality of dependent variable within each condition. The results indicated a significant improvement in scores after the intervention, t(df) = t-statistic, p = p-value, suggesting that the intervention was effective.”
5.4 Dr Clarke’s Automatic t-test Generator
Lately, I’ve been learning to code and, well, I’ve made something for you:This link takes you to a web application that automatically generated data for an independent samples t-test, performs the analysis and then reports the findings.
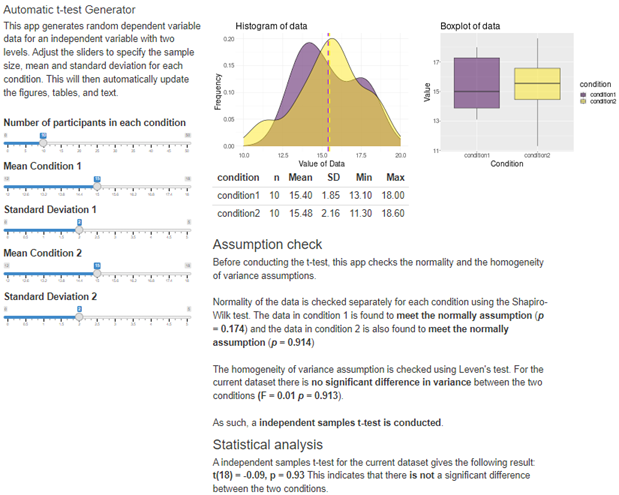
By moving the sliders around you should be able to see how data with different means and SD look and how they affect the assumption checks, choice of test, statistical significance (and observed power, effect size, both of which are explained in detail in the next chapter).