Code
install.packages("tidyverse")R is a programming language that you’ll be learning to write code in, while RStudio is what is known as an Integrated Development Environment (IDE) which makes working with R easier. I will largely use the terms “R” and “RStudio” interchangeably throughout this course, but you can think of writing in R as you would writing in English and RStudio the program you write it in. You could write all your written assignment in NotePad but Microsoft Word gives you a lot more freedom so that’s often the default. The same logic is true for R, using RStudio just makes life a lot easier.
To get started you will first need to install the language R and then the IDE of RStudio. Both can be installed, for free, from the company that maintains them, Posit. From there you will then need to select your operating system (Windows or Mac).
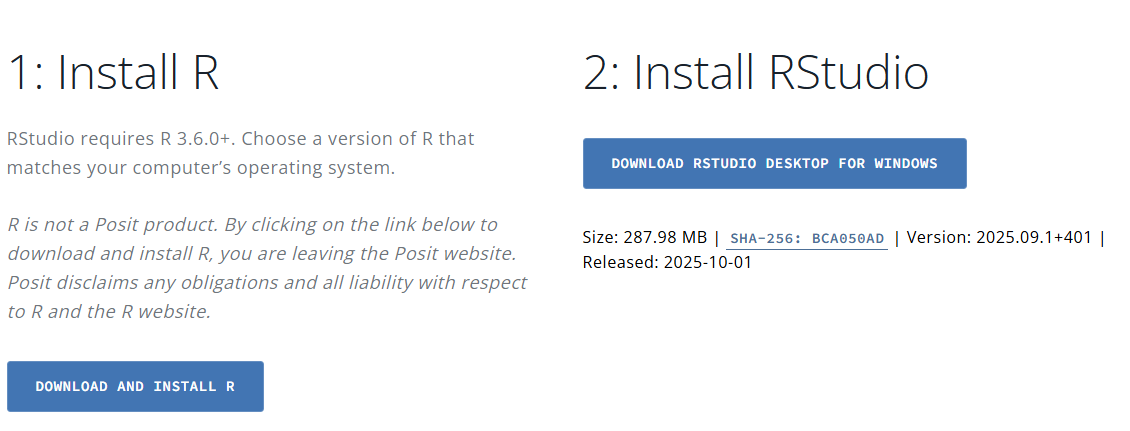
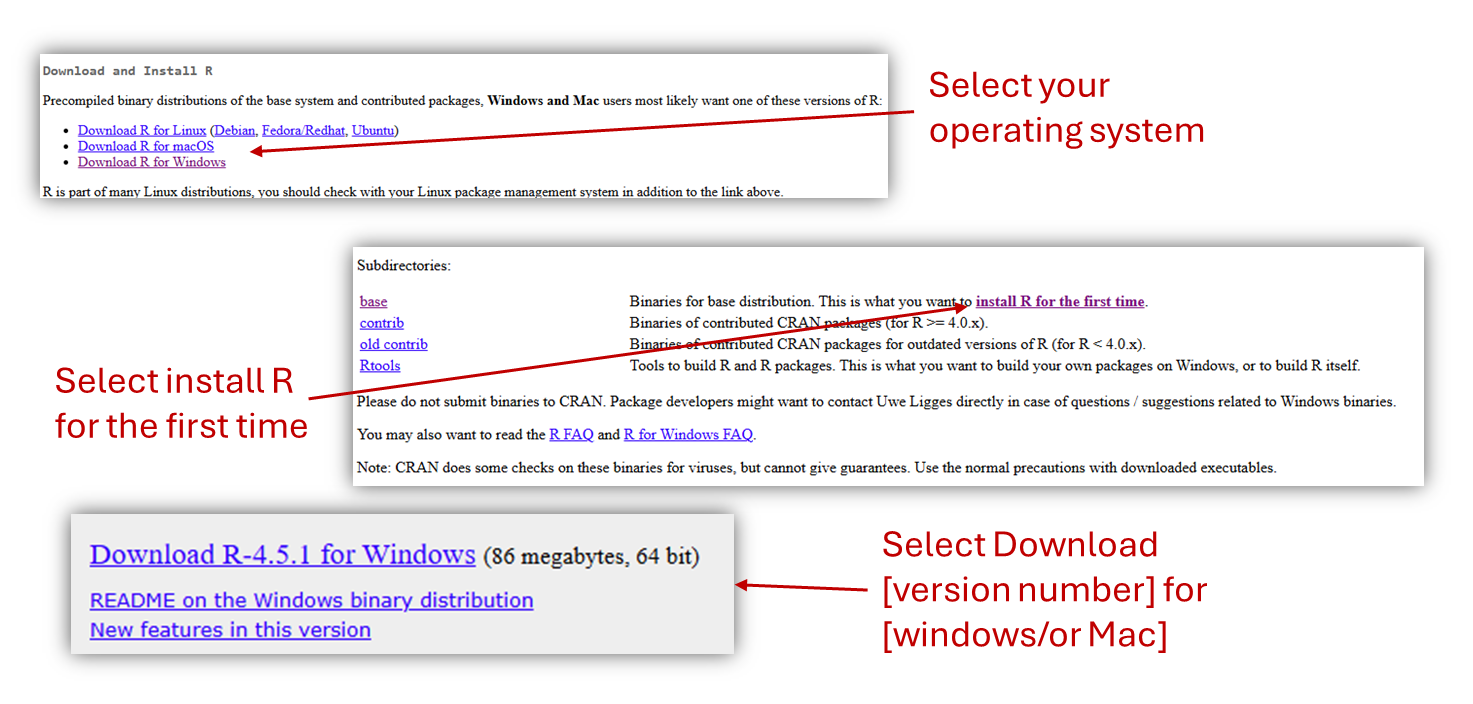
Follow these steps for the R language:
 Then go back to the main page, download and install RStudio.
One of the best things about using R and RStudio is that they are both very widely used across many academic disciplines, and in the professional world. As such there are many guides for installation. If you hit on an issue with installation, it’s very likely others have too. Here are some helpful links to help you install R and RStudio your own home computer (which I highly recommend you do):
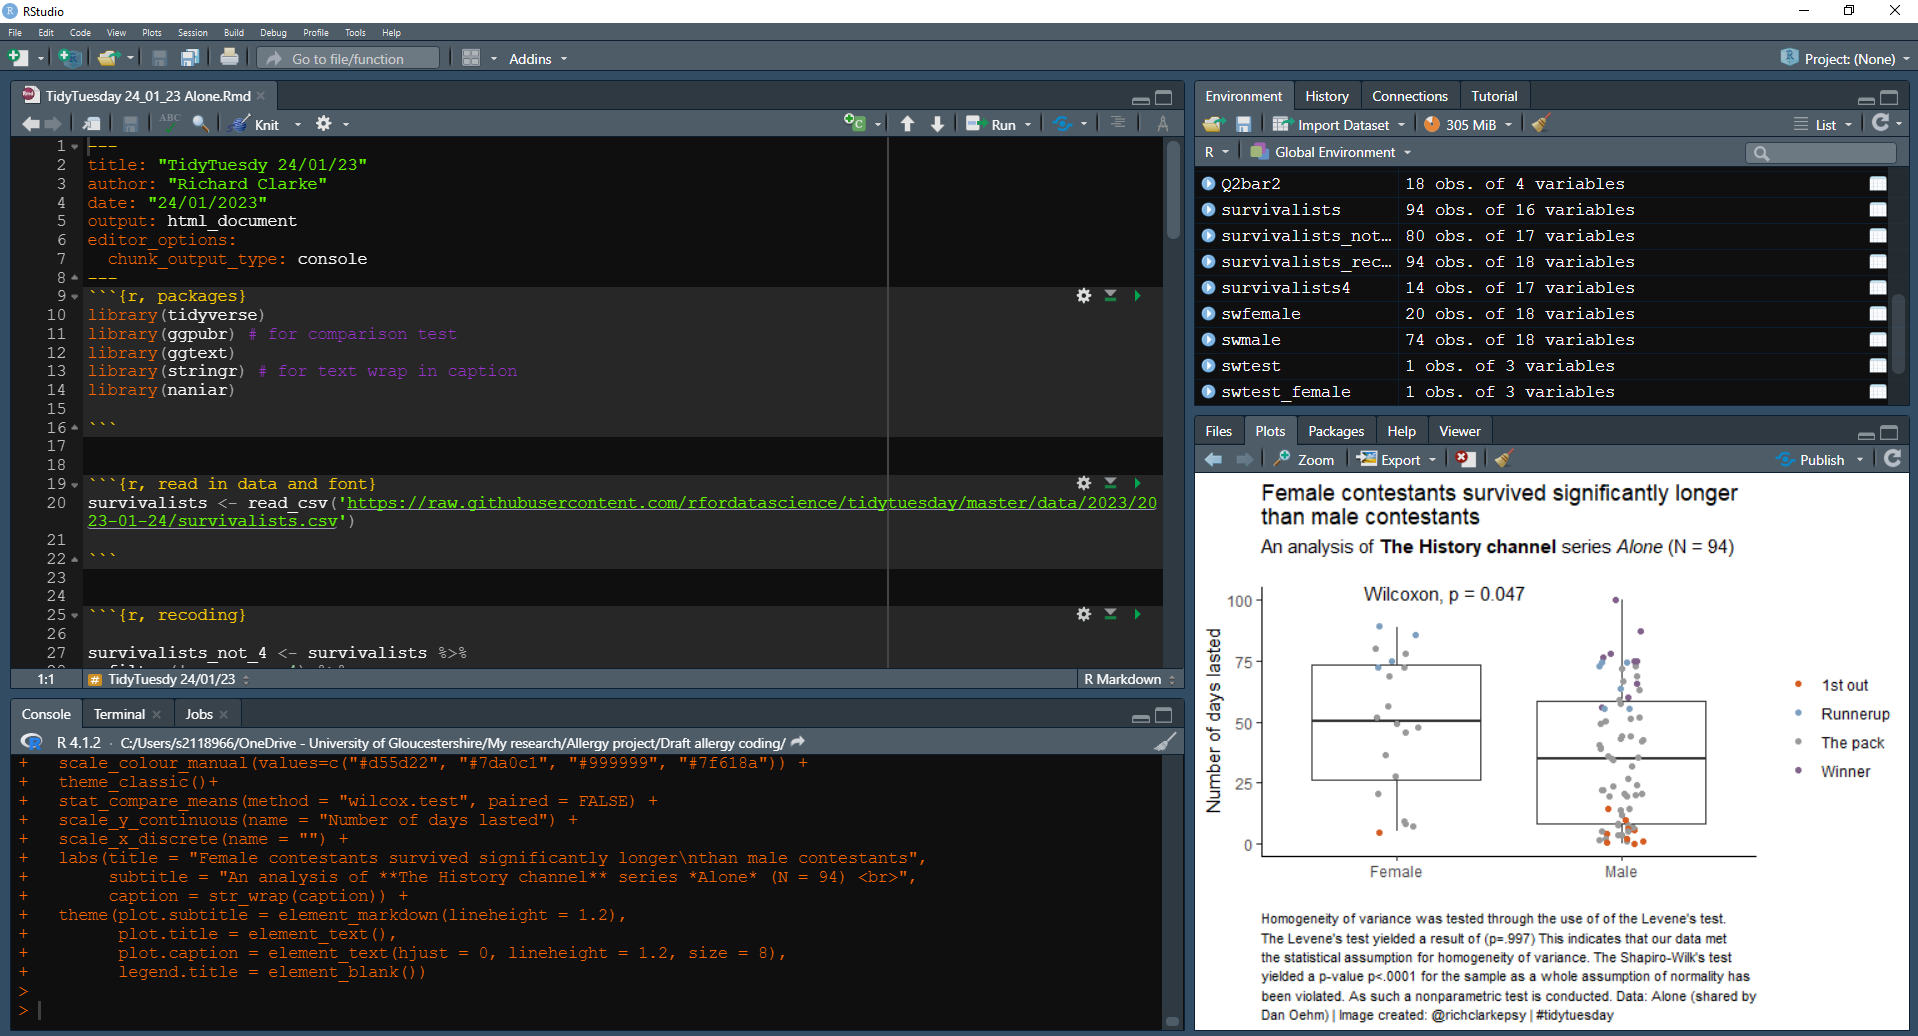
When you first open RStudio you should be greeted by a page that looks like this:
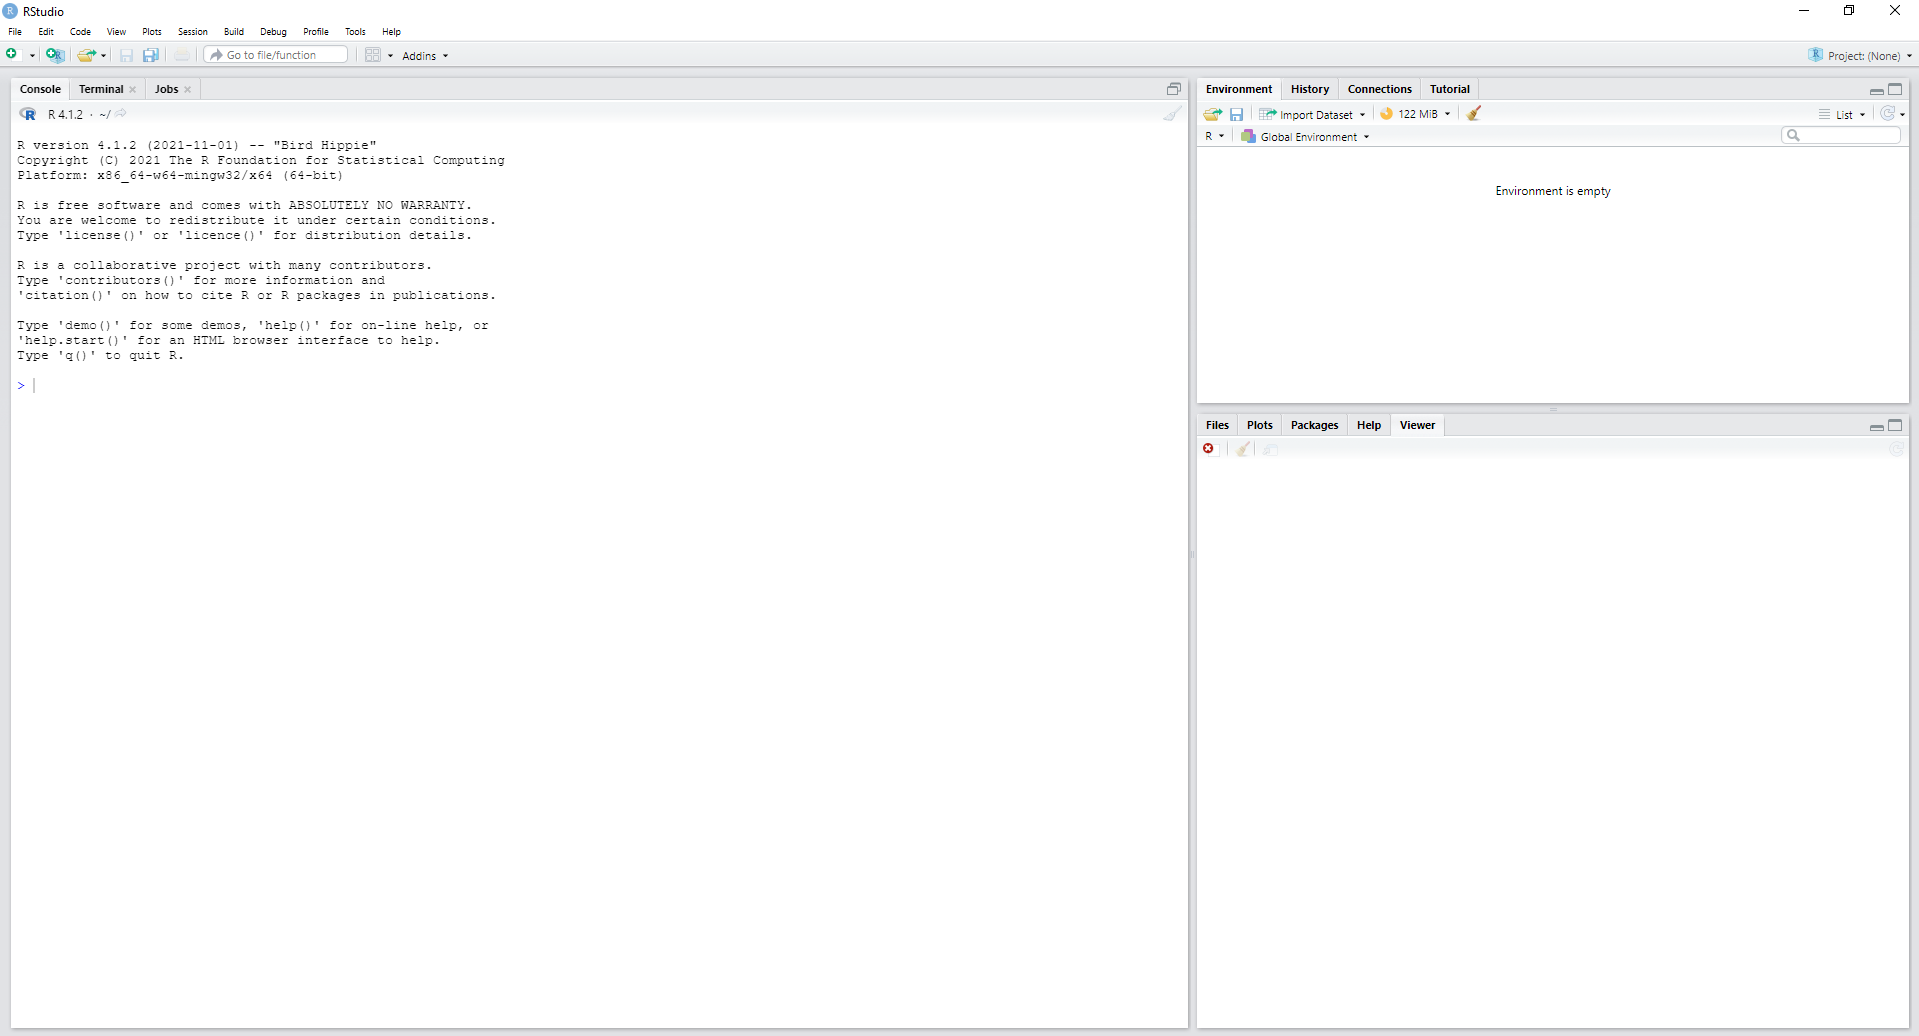 If not double check that it is RStudio that you are opening and not just R in a text editor.
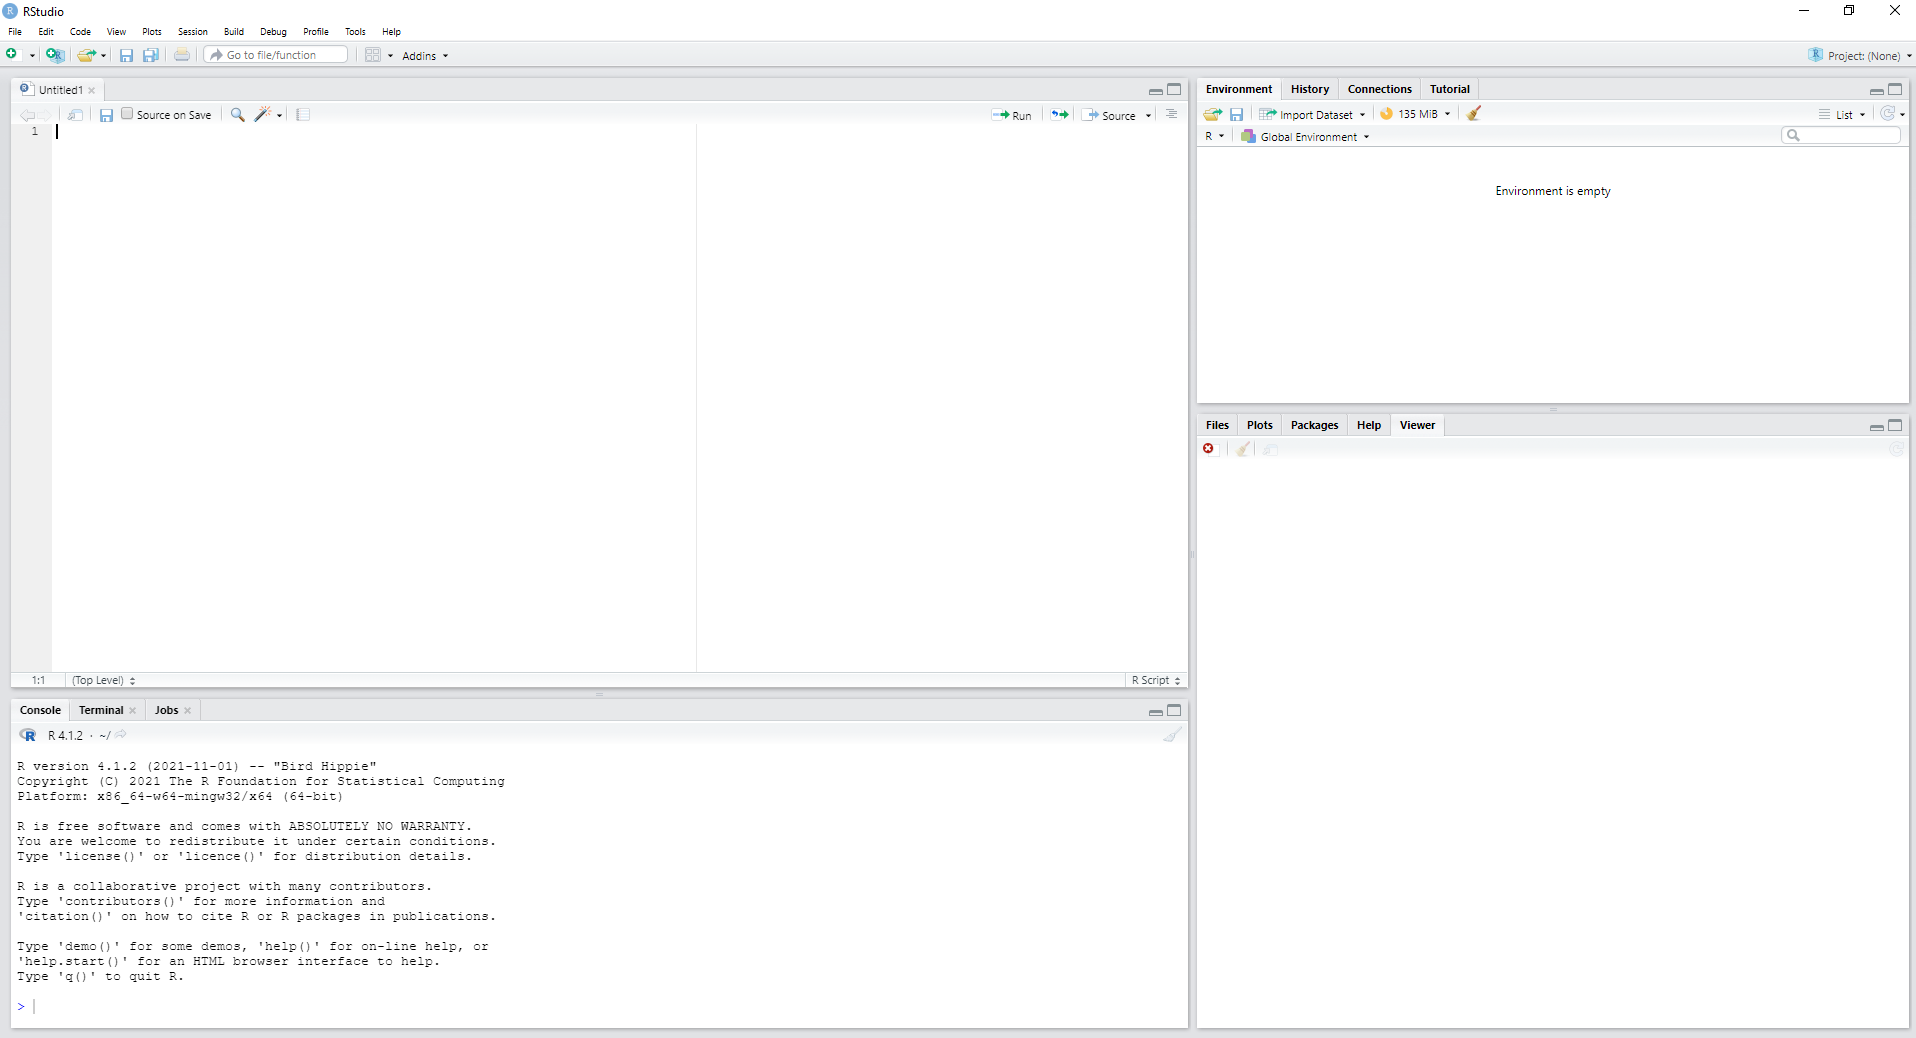
First thing I suggest you do is click File -> New File -> R Script. This will show you the normal view you will get when working in R. Here you have four segments to your screen:
 You’ll become intimately aware of what each of these areas do over the course of this module but if you want a overview of these sections now this video gives a good introduction to each section (I recommend watching from around 5mins 45sec).
Finally, for the basic set up, it is very important to look cool while doing your analysis in R. To change the basic appearance:
Click Tools -> Global Options -> Appearance.
I like the Editor Theme Vibrant Ink. It makes me feel like I’m a hacker from the 90’s. Also, if you’re getting old like me you may want to make use of View -> Zoom in option to increase the size of the text.
Stressed yet? Don’t worry, we’ll have your screen looking like this in no time. There is a learning curve for R but once things start to click you’ll love it!
The basic functions of R are great, but one of the most useful things about working in R (instead of the commercial software) is its ability to incorporate user generated content to customise what we’re able to do. Such add-on content are known as packages. The validated and most frequently used packages are stored on the CRAN (Comprehensive R Archive Network) server and RStudio knows exactly where to find them, as long as you know the name of the package. So no need to click around random websites downloading files to install, which is nice.
For this module we will make extensive use of the tidyverse package. This is a package full of the most frequently used packages in R coding, bringing together a set of grammar and visulisation tools that makes the process of writing in R a whole lot easier.
To install the tidyverse package type the following code into your console (next to the bottom >) and then hit the enter key to run the code. Or you can copy and paste directly from this document by clicking the clipboard icon in the top right of the box.
install.packages("tidyverse")You only ever need to install a package once per computer, but you will need to load it each time you open RStudio. In these subsequent times this is the only code you’ll need:
library(tidyverse)For each analysis that you conduct it’s a good idea to include the packages as the first code on the script, so copy out this code and place it at the top of your new script (top left of your screen, if you’ve created one).
To run this, and any code, you can either highlight the code and click the Run button in the top right of the script window. Or you can navigate to the line that you want to run and hit Ctrl+Enter.
Another excellent reason to move your data analysis over to R is the extent of the vibrant online community that’s available to help you learn.
For instance, this is a video that I’m sure has started many R learning journeys in the last few years:
Here are some of my other favorites:
PsyTeachR is the resource that the University of Glasgow uses to teach their undergraduate and postgraduate psychology students R. This is the resource that I used when I was first learning to code (which was only around 3 years ago) and it’s my inspiration for writing this handbook. Their Data Skills module is a good place to start.
R for data science by Wickham, Çetinkaya-Rundel & Grolemund is a the way to code with the Tidyverse, as it is written by those that maintain the code.
Lots of depth here, and great if you want to gain a deeper understanding rather than just rely on editing the code I give you.
Also if I code one way, and they do the same task another way, do it their way! They are likely (more) right.
Want more datasets to explore with your new skills? R tidyverse has a number of built in datasets that are clean and easy to use. Here are some commonly used ones:
starwars - Data on characters in the Starwars universe (in tidyverse package)
mtcars - Car specs and performance. (in datasets package)
diamonds - ~54k diamonds with price and characteristics (in tidyverse package)
iris – Iris measurements by species (in datasets package)
Once tidyverse or datasets is loaded each dataset can be loaded by simply calling it
data_starwars <- starwarsTidyTuesday is an online community of hobbyists and professionals that work with data. Each week they release a new dataset and those in the community analyse and visualise the data and share online with the rest of the community.
Recent datasets include:
Scroll down on each of the links to give you a description of the dataset and info on how to read the dataset into R.
Search #TidyTuesday on twitter and elsewhere to get an idea of what the community creates. Often they also share their code.
YouTube was indispensable when I was first learning R. This was the first video I saw on the topic: R programming in one hour - a crash course for beginners.
Here are some channels recommendations:
NS7154 Handbook by Dr Richard
Clarke - University of Gloucestershire - rclarke8@glos.ac.uk
Special thanks to Llivia Hales for
editing, testing, and session support!